AI-powered B2B SaaS integrating
Logistics (DVRP) and POP (MES + ERP + WMS) data
around the International Trade Platform (REINDEERS)

2026Thailand Platform Launch
$130BSEA B2B Market Size
HKTDC Research 2025
$108B+Industrial Materials TAM
Based on ASEAN Manufacturing GDP
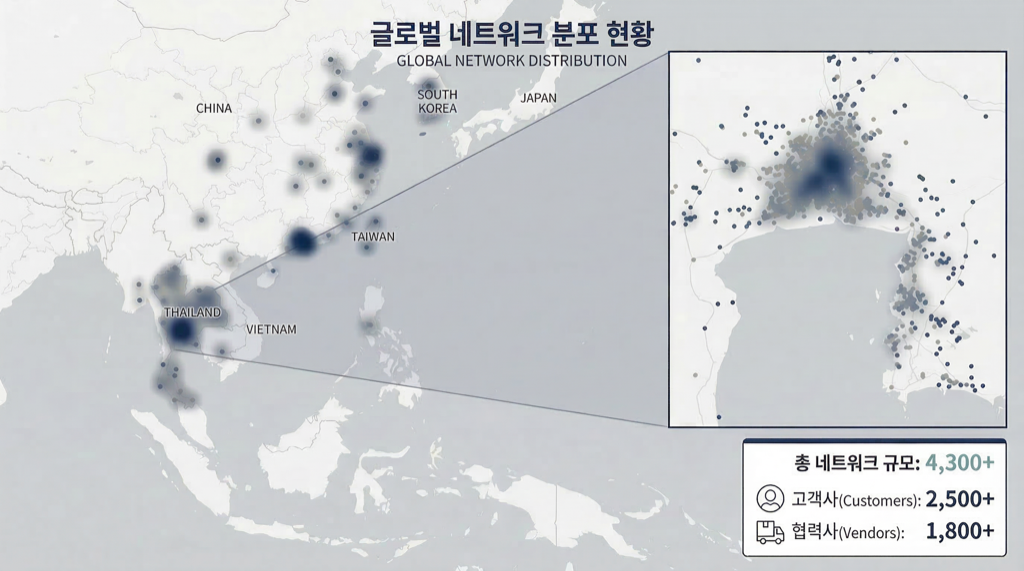
4,300+Local Partner Companies
6Integrated Platforms
HISTORY

From Business Validation to AI Technology Company

Phase 1: Local Supply Chain Operations (2015~2021)
Started local supply chain operations in Thailand. 2,500+ customers, 1,800+ suppliers.
Cumulative 25,000 transaction records.
1
2
Phase 2: Incorporation & Technology Foundation (2022)
Korea & Thailand subsidiaries established. R&D center founded.
Selected for Pre-startup Package.
Phase 3: AI Technology Company Transition (2023~2024)
Malaysia subsidiary established. Venture company certification.
Supply chain patent registered.
3
4
Phase 4: Global Expansion & AI Commercialization (2025~2026)
China subsidiary established. AI service Thailand launch.
SEA expansion preparation.

Local Operations (2015) → Incorporation (2022) → AI Transition (2023) → Global Expansion (2025~)

COMPANY OVERVIEW

REINDEERS Co., Ltd.

An AI-powered B2B SaaS platform company built on 11 years of trade & logistics operational experience in Southeast Asia.

Founded

Founded in Thailand, 2015
11 years of hands-on trade
& logistics operations

Vision

Unifying trade, logistics
& POP into one AI-powered
platform across borders

Mission

Eliminating structural
inefficiency & info asymmetry
in B2B supply chains with AI

Strength

11+ years of SEA expertise
2,500+ clients · 1,800+ suppliers
4-country network · proven team

CORPORATE BRANCH

CountryCompany NameAbbreviationAddress
Korea (HQ)REINDEERS Co., Ltd.REINDEERSSeoul, Korea
ThailandREINDEERS FULFILLMENT CO., LTD.REINDEERSBangkok, Thailand
I-Market (Thailand) Co., Ltd.I-MarketBangkok, Thailand
MalaysiaReindeers SDN. BHD.REINDEERSShah Alam, Malaysia
China苏州睿鹿科技贸易有限公司Ruilu TechSuzhou, China
ExpansionYancheng, China · Vietnam2026 · 2027Jiangsu, China · TBD
CORPORATE STRUCTURE

Global Entity Network

Holding & subsidiary structure across 4 countries with planned expansion

Seoul (HQ) Yancheng '26 Suzhou Vietnam '27 Bangkok Shah Alam
Active Planned New Market
Korea (HQ)Seoul

⊕ REINDEERS

CEO 90%SDN.BHD. 10%
ThailandBangkok · 2

⊕ REINDEERS

I-Market 5%REINDEERS 95%

⊕ I-Market (Local 3PL)

MalaysiaShah Alam

⊕ REINDEERS

IMUSCLES 51%REINDEERS 49%
ChinaSuzhou

⊕ Ruilu Tech

Now

Local Partner 100%

Target ↓

Local Partner 51%REINDEERS 49%
Expansion Roadmap
Yancheng, China 2026Vietnam 2027
CEO PROFILE

CEO Myunghoon Kim

CEO Myunghoon Kim
CEO Myunghoon Kim
2022~
CEO
2016~2022
Managing Director
2010~2014
Management Support Lead
2006~2008
Financial Controller
2003~2006
Finance Major

Southeast Asia Local Expert

  • 20+ years of experience in Thailand & SEA countries
  • Master's degree from Assumption University, Thailand (Finance)

Large Corporate Subsidiary Management (10 years)

  • Samsung Electronics Thailand, Management Support Team Lead
  • Corporate management · ERP · SCM · logistics · finance integrated operations

Local B2B Business Operations (11 years)

  • Founded & operated integrated procurement & distribution company in Thailand
  • Secured 2,500+ clients and 1,800+ suppliers
  • China-Laos-Thailand-Malaysia overland logistics specialist

Business Network

  • Supplied to 150+ Korean companies incl. Samsung, LG, POSCO in Thailand
  • Established Thai local distribution network & BNI business network

20+ years in Thailand · 9 years corporate subsidiary management · 11 years B2B supply chain — Proven field expert

CORE TEAM

Core Management Team

NHN affiliate talent — Avg. 15+ years in commerce, logistics & AI

CSO
CSO

PARK JUNYOUNG

Ajou Univ. MBA (CS)

Career

  • Madeitup CEO
  • Munmu Director
  • Custommind CTO
  • NHN Acommmate CTO

Expertise

  • Commerce/Logistics 20yr+
  • Org Management & P&L
  • Cross-border BM Design
  • NHN Strategic Leadership
Global Commerce & AI
20+ Years
CPO
CPO

JIN CHENGJI

JiangXi Univ. CS

Career

  • Basheng Network Tech CEO
  • Custommind Director
  • NHN Acommmate Div. Head

Expertise

  • B2B SaaS Planning 15yr+
  • Logistics Workflow Design
  • Commerce Platform Dev
  • Data-driven UX
B2B SaaS Product Planning
20+ Years
CTO
CTO

ZHOU QIRONG

SanJiang Univ. CS

Career

  • Basheng Network Tech CTO
  • Custommind Division Head
  • NHN Acommmate Team Lead

Expertise

  • AI/LLM/RAG Application
  • Distributed Systems 10yr+
  • Real-time Data Processing
  • NHN Tech Stack Proven
AI · LLM · RAG Expert
15+ Years
COO
COO

ZHANG WEI

Shenzen Univ. FN

Career

  • SEA Logistics Ops 8yr+
  • TH/VN Partner Building
  • Cross-border Customs Ops

Expertise

  • SEA Network Building
  • Logistics · Customs Opt.
  • 3PL Ops & QC
  • Local Regulatory Compliance
SEA Trade · Logistics Ops
8+ Years
MARKET SCALE

Target Market Scale

The Asian B2B industrial materials market REINDEERS targets is a massive, largely undigitized opportunity.

$2.1T
ASEAN Manufacturing Output
$130B+
B2B Digital Commerce
HKTDC Research 2025
4,300,000+
Total Manufacturers in Target Region

Registered Manufacturers by Country / Region

CountryRegistered Mfrs.Mfg/GDPKey Industries
Thailand79,000+26%Automotive, Electronics, Food
Malaysia50,000+23%Electronics, Petrochemical, Rubber
Vietnam140,000+24%Electronics, Textiles, Machinery
Laos+Cambodia+Myanmar16,000+15~20%Textiles, Agriculture, Light Mfg.
Indonesia30,000+20%Metals, Chemicals, Food
China3,500,000+27%All sectors, World’s factory
South Korea430,000+25%Semiconductors, Auto, Steel

4.3M+ manufacturers in target region — B2B digital adoption <5% — A massive untapped market for REINDEERS

MARKET ANALYSIS

Market Penetration & Revenue Growth Path

Current penetration 0.004% vs TAM $108B+ — massive growth headroom

TAM — SEA Industrial Materials B2B
$108B+
Thailand
$18.6B
Indonesia
$54.0B
Vietnam
$14.4B
Malaysia
$11.4B
Performance-Based Market Penetration Path
YearRevenuevs ThailandStage
2024540M KRW0.002%Direct export 18 deals
2025960M KRW0.004%Direct export 59 deals · YoY +77%
2026420M KRW0.002%Platform BM transition
202719.1억0.010%Breakeven · 250 clients · Vietnam expansion
20284.98B KRW0.020%Multi-country expansion
203025.46B KRW0.10%Full SEA expansion
+77%
2024→2025 YoY
~90%
2024→2030 CAGR
0.10%
2030 Penetration

Even at 2030 target revenue of 25.46B KRW, Thailand market penetration is only 0.10% — overwhelming growth headroom relative to total SEA market

MARKET OVERVIEW

SEA Industrial Materials Market Overview

15%
Annual Market Growth
$108B TAM · Fast-growing market
Yet
30%+
of transactions are delayed
Document errors · Manual work · No systems
Structural Inefficiency

Why must this problem be solved?

The SEA B2B industrial materials market is growing at 15% annually, yet fragmented systems and manual processes delay 30% of transactions, creating billions of dollars in annual opportunity cost.

→ $30B+ annual opportunity cost
Outdated Digital Landscape

How do we solve it?

REINDEERS (trading) · DVRP (logistics) · Forwarder Bidding (competitive freight) · POP (MES+ERP+WMS) unified into a single data model, with AI assisting decision-making across all processes.

→ 6 platforms, one unified data model
Increasing Regulation

What do we achieve?

Trade lead time 50% reduction (30d→15d) · OpEx 30% savings · Logistics cost 15-20% reduction · 100% supply chain visibility · Regulatory compliance automation (TISI·CCC·KC) · 2030 GMV ₩294B

→ Lead time 50%↓ · OpEx 30%↓

Target: #1 market share in SEA B2B trade platform market by 2030

MARKET OPPORTUNITY

SEA Industrial Materials Supply Chain: Why Now

System Disconnection

Trade · logistics · ERP systems operated independently. Less than 5% of companies have internal systems

Complex Distribution Structure

Regional dealer margins 30%+, imported goods distribution margins 50%+

No Direct B2B Platform for Industrial Materials

LAZADA · SHOPEE are B2C open markets that do not support industrial materials B2B trade

Manual Process Dependency

Core tasks like quotations · documents · logistics · settlements handled via email and spreadsheets

Decision-Making Delays

Lack of real-time data makes supply chain visibility impossible

High Customs Barriers

HS Code classification errors, complex certification procedures like TISI cause frequent trade delays

SEA B2B E-commerce Market Size

(2026 Estimate)

$54.0B Indonesia $18.6B Thailand $14.4B Vietnam $11.4B Malaysia $9.6B Philippines Source: Internal estimate based on ASEAN manufacturing GDP
$108B+
Total Addressable Market — SEA Industrial B2B

Average 30% of international trade transactions are delayed due to document errors · communication delays → Tens of billions in annual opportunity costs | Market CAGR 15% growth

DIGITAL TRANSFORMATION GAP

Industrial Materials Supply Chain with Zero DX/DA Transformation

DX - Digital Transformation

< 5%
Digital system adoption rate
Orders, quotes, logistics, settlements scattered across email/Excel
No dedicated B2B industrial materials marketplace
Local and cross-border supply chains completely disconnected

AX - AI Transformation

<1%
AI utilization rate
Data exists but fragmented and unstructured across systems
Demand forecasting and risk management entirely experience-based
AI-ready areas like HS Code, TISI, quotes still manual
Current vs After REINDEERS
Area Current (Manual) After REINDEERS Impact
Quotation 2-3 days manual comparison AI auto-comparison in 30 min 90%↓
HS Code Manual classification, frequent errors AI auto-classification, 85%+ accuracy 85%+
Logistics Cost Individual forwarder inquiries, 1-2 days Forwarder bidding, real-time comparison 15~20%↓
Inventory Manual Excel entry, no real-time POP real-time sync, auto alerts Real-time
Documents Half-day manual (CI·PL·B/L) Document AI auto-generation 80%↓
Workflow Email/phone, no tracking Workflow AI automation, full tracking Auto

No AX without DX, no DX without data — REINDEERS executes sequential DX→AX transformation based on 11 years of field data

REGULATION ENFORCEMENT

Opportunities Created by Strict Import/Export Regulations

Problem
Surging crackdowns on counterfeit & uncertified products
Opportunity
AI-based certification & customs automation emerging

HS Code / TISI Enforcement Results (2026 Est.)

CategoryValueYoY Change
Steel & construction materials seized155M THB↑ 37%
Electrical · electronic products130M THB↑ 32%
Tires · rubber products100M THB↑ 25%
Violating goods destroyed1.8M items↑ 18%
Online URLs shut down9,500+ (TISI Watch AI)↑ 30%

Legal Penalties by Risk Type

CategoryValueYoY Change
Customs evasionFine of 50%~400% of unpaid tax↑ 85%
TISI violation (imports)Up to 2 years imprisonment or 2M THB fine↑ 17%
False origin declarationAdditional 40%+ tariff on applicable goods↑ 16%
HS CODE violationFine up to 500K THB↑ 18%
Uncertified productsUp to 6 months imprisonment / fine up to 500K THB↑ 30%

Regulatory tightening is not a crisis but an opportunity — It directly creates market demand for AI-based certification · customs automation platforms

OUR SOLUTION

How Do We Solve the Problem?

REINDEERS
Platform

Global Trading & E-commerce Platform

Live
  • Buyer-Vendor-Forwarder integrated workflow
  • Quotation to settlement AI automation
  • AI-based HS Code & certification auto-classification

DVRP
Platform

3PL Operations SaaS

Mar 2026 BETA
  • Inventory, inbound/outbound, truck dispatch
  • Real-time sync with REINDEERS orders
  • Mobile & tablet apps + work device provided

Forwarder Bidding
Platform

Competitive Freight Bidding

Live
  • Real-time multi-forwarder quote comparison
  • AI-based optimal forwarder recommendation
  • Average 15-20% logistics cost reduction

POP
Platform

POP (MES + ERP + WMS) All-in-One SaaS

2026 Q2 Launch
  • MES (production) + ERP (procurement·sales·inventory) + WMS (warehouse)
  • Email · Company site · Doc AI · Workflow AI
  • Mobile & tablet apps + work device provided
  • REINDEERS · DVRP data real-time sync

6 platforms unified under a single data model — Quotation · order · logistics · production data linked per transaction, automatically generating AI training datasets

WORKFLOW

18-Step Integrated Trade Workflow

PHASE 1 — Purchase Request ~ Advance Payment PHASE 2 → 01 Purchase Request AI demand analysis · auto PR 02 Supplier Search AI matching · candidate list 03 Request for Quote (RFQ) AI auto RFQ · multi-dispatch 04 Quote Comparison Price·MOQ·lead time comparison 05 Purchase Order (PO) AI optimal terms → auto PO 06 Advance Payment Escrow payment (T/T·L/C) 07 Production Start AI forecast → schedule monitor 08 Quality Control (QC) AI quality · inspection report PHASE 2 — Export Preparation ~ Export Clearance PHASE 3 → 09 Forwarder Bidding Multi-bids → AI optimal pick 10 Export Documentation AI auto doc (CI·PL·B/L·C/O) 11 HS Code Classification AI auto-classify · cert verify 12 Export Clearance AI customs risk analysis PHASE 3 — Shipping · Transport ~ Final Settlement · Evaluation 13 Shipping · Transport AI route → real-time tracking 14 Import Clearance AI cert · customs automation 15 Duty · Tax Payment AI tariff calc → tax payment 16 Balance Payment Escrow balance after confirm 17 Receiving · Inspection AI quality check → PO verify 18 Settlement · Review AI eval → data learning AI support at key steps — Learning from 18-step data 3-party (Buyer·Vendor·Forwarder) data per transaction

AI at key steps — 3-party data accumulated per transaction for progressive learning

OUR APPROACH

AI Technology Development Through 3-Stage Supply Chain Integration

STAGE 1 Local Supply Network 11 years proven in Thailand 2,500+ customers · 1,800+ suppliers Replicating to new countries Procurement · pricing · inventory data Core AI training data secured ✓ Validated STAGE 2 Cross-border Supply Network Korea · China supply hubs ↔ SEA demand market connection Logistics · customs · certification data Local data + Cross-border combined End-to-End visibility achieved ▶ In Operation STAGE 3 AI Supply Chain Infrastructure Unified data-driven AI infra Demand forecast · supplier matching Logistics optimization · risk mgmt RAG + AI Agent automation Supply chain decision automation ▶ 2026 Launch Local Data Accumulation (11yr) → Cross-border Integration → AI Infra = End-to-End Automation Each stage's data becomes the training data for the next stage's AI model

Thailand Local 11yr validation (2015~) → Incorporation (2022) → AI Launch (2026)

Country-level replication + Cross-border integration for End-to-End infrastructure.

DATA ASSET

3-Layer Data Asset & Integrated Architecture

Layer 3 — Integrated Supply Chain

Integrated Supply Chain Optimization Data

AI: Supply chain optimization · forecasting · E2E automation

2,500+Clients
1,800+Suppliers
Layer 2 — Cross-border

International Trade · Logistics · Customs

AI: Logistics variables · customs risk · route optimization

5 CountriesRoutes
8,400+HS Code
Layer 1 — Local Supply (Core)

Thailand Local Real Transaction Data

AI: Demand patterns · price fluctuation · delivery forecast

25,000+Transactions
11yrOperations
Learn Agent Data Flywheel Unified Data Asset REINDEERS · Forwarder Document AI DVRP POP Workflow AI AI Agent · All Platform Automation
AI Agent
Workflow AI Agent

Learns from 6 platform data → provides AI automation across all platforms: REINDEERS, Forwarder, DVRP, POP, DAI, WAI

Single DB + 6 platform integration — Workflow AI Agent automates all platforms · data accumulation → continuous AI improvement

PARTNERS

Local Partners Built Over 11 Years

Buyers
2,500+
Cumulative Clients
Vendors
1,800+
Suppliers
Network
20+
Local Associations
Forwarders
30+
Forwarder Partners
Korea
150+
Korean Companies
Thailand (TH)
Core Hub
4,300+ clients & suppliers
11-year proven market
Malaysia (MY)
Logistics Hub
DVRP operations expanding
Warehouse & delivery infra
China (CN)
Supply Hub
Largest supplier sourcing
Overland logistics specialist
Vietnam (VN)
Manufacturing Expansion
Surging manufacturing demand
Supply chain relocation benefits
Korea (KR)
Home Market
Samsung · LG · POSCO etc.
150+ companies served

11 years of trust relationships and transaction history form an entry barrier that new entrants cannot replicate in the short term

BUSINESS MODEL

SCM-Based Platform Revenue Structure

6 Platforms → Central AI Flywheel → Multi-layer Recurring Revenue

Data Flywheel AI Learning · Decision Support REINDEERS Transaction Fee 10% Forwarder Bidding Logistics Fee 10% Document AI Token Billing Workflow AI Token Billing DVRP SaaS 1M KRW~/mo (3PL) POP SaaS 1M KRW~/mo Commission 10% + SaaS + Token = Multi-layer Recurring Revenue ₩ Fee 10% ₩ Fee 10% ₩ Token ₩ Token SaaS ₩1M~/mo SaaS ₩1M~/mo
Commission Revenue
%

Transaction Fee

10% of GMV

Cross-border: Buyer pays · Local: Vendor pays

%

Forwarding Fee

10% of Freight

Forwarder pays · Multi-bidding saves shippers 15~20%

SaaS Subscription
S

DVRP

1M KRW~/mo

2026 internal I-Market · then external 3PL expansion

S

POP

1M KRW~/mo

MES + ERP + WMS integrated · Tiered pricing by modules

AI Service
AI

Document AI · Workflow AI

Token Billing

Usage-based pricing · Workflow AI Agent automates all platforms

$

Net Profit Structure

Commission 10% − overhead 2~3% = Net margin 7~8% + SaaS + Token

Transaction fees + forwarding fees + SaaS + Token = multi-layer recurring revenue · Data accumulation → higher AI accuracy → platform value growth

COMPETITIVE ADVANTAGE

Competitive Advantage: High Technology Barriers

Competitor Comparison Positioning

FeatureREINDEERSFlexportSAP/OracleLAZADA/
SHOPEE
Trade Platform
WMS/3PL
POP Integration
Forwarder Bidding
SEA Specialized
AI Decision-Making
AI Agent Automation
Document AI
Workflow Automation
SME Pricing

6 Core Entry Barriers

1

Platform Integration Complexity

Full trade · logistics · POP integration requires 5+ years of domain experience

2

AI Agent Technology

Proprietary Document AI · Workflow AI · Decision AI, domain-specialized models trained on 25,000+ real transactions

3

Network Effect

Multi-sided platform maximizes defensibility after reaching critical mass

4

11-Year Partner Network

Trust relationships with local suppliers · forwarders · clients

5

Data Accumulation Effect

More transactions → higher AI accuracy → increased platform value

6

First-Mover Advantage

SEA B2B platform at early stage, high switching costs

These factors form a Technological Moat, creating a structure that is difficult for latecomers to penetrate in the short term

PATENT PORTFOLIO

Building IP Through Patent Portfolio

2023 Patent Registered

Integrated Support System and Method for Import/Export Management

Patent No. 2746311 · KIPO Registration Complete

Patent Certificate
2024 Patent Registered

AI Model-Based Process-Specific Industrial Material and Supplier Recommendation Method and Device

Patent Filed · KIPO Registration Complete

Patent Registration

Building a patent portfolio for core technologies to secure IP-based technological competitiveness

REVENUE

Revenue Actuals & 2026–2030 Growth Plan

2025 Revenue (Direct Export)
960M KRW
Net ~100M · Operating loss
2026 Target (Platform Transition)
GMV 5.1B
Revenue 420M · 120 Clients
2027 Breakeven
GMV 22B
Revenue 1.91B · 250 Clients
2030 GMV Target
294B KRW
Revenue 25.46B (8.7%)
3,000 2,000 1,000 0 51 4.2 2026 220 19.1 2027 564 49.8 2028 1,344 117.6 2029 2,940 254.6 2030 GMV (100M KRW) Revenue (100M KRW)
Unit: 100M KRW
Year Clients GMV Comm. SaaS·AI Revenue OpEx Op. Profit
2024 5.4 0.5 0.5 6.0 -5.5
2025 9.6 1.0 1.0 6.0 -5.0
2026 120 51 3.6 0.6 4.2 8.0 -3.8
2027 250 220 15.4 3.7 19.1 10.5 +8.6
2028 450 564 39.5 10.3 49.8 21.0 +28.8
2029 750 1,344 94.1 23.5 117.6 38.0 +79.6
2030 1,250 2,940 205.8 48.8 254.6 75.0 +179.6

Commission: GMV × 7% net (after PG fees) | SaaS: DVRP·POP subscription | AI: Document·Workflow Token
Avg. order freq. 2.5→6.8×/mo, order size 3M→3.6M KRW. Details: next page

2024–2025 direct export → 2026 platform transition (120 clients) · 2027 breakeven · GMV CAGR ~176% (2026→2030) · Take Rate 8.7%

HOW WE EARN

2027 Revenue Structure

How a transaction becomes revenue (2027 breakeven basis) Clients 250 companies (2027) 120 → 250 ×2.1 growth × Order Value 310 만원 (2027) 300만 → 310만 SEA avg. price × Monthly Freq. 3.2 orders/mo (2027) 2.5 → 3.2 ×1.28 growth Annual GMV 220 억원 (2027) Existing 12mo + New 6mo weighted Breakeven Year Take Rate 8.7% Gross 10% − PG fees 2~3% = net 7% + SaaS + AI Transaction Fee 15.4 81% 7.0% of GMV (gross 10% − PG 2~3%) Auto-charged on every transaction · core revenue Earned across ordering, payment & settlement SaaS Subscription 2.8 15% DVRP (logistics) + POP (procurement·inventory) ₩1~1.3M/mo per client · MRR-based Recurring revenue regardless of transactions AI Token 0.9 4% Document AI + Workflow AI usage billing ARPU ₩100~150K/mo · usage-based Higher AI accuracy → more dependency → ARPU ↑ 2027 Total Revenue ₩19.1B · Op. Profit +₩8.6B

8.7% of every transaction automatically becomes platform revenue — 2027 breakeven: 250 clients × ₩3.1M per order × 3.2 orders/mo = GMV ₩22B → Revenue ₩1.91B (Op. Profit +₩0.86B)

GROWTH BASIS

Growth Rationale & Bottom-up Validation

1Per-client Order Metrics

Year Order Size Freq./mo Monthly Annual
2026 3.0M 2.5× 7.5M 90M
2027 3.1M 3.2× 9.92M 119M
2028 3.2M 4.2× 13.44M 161M
2029 3.4M 5.5× 18.70M 224M
2030 3.6M 6.8× 24.48M 294M

Based on SEA supply chain avg. order size, natural frequency growth

22026 Monthly Client Onboarding

5Jan 6Feb 8Mar 9Apr 10May 10Jun 11Jul 11Aug 12Sep 12Oct 13Nov 13Dec Total 120 clients | 681 client-months × 7.5M = GMV 5.11B KRW

3GMV Bottom-up Validation

Year Existing × Annual New × Half-yr Calc. GMV
2026 681 client-mo × 7.5M 5.11B
2027 120 × 119M = 14.28B 130 × 60M = 7.74B 22.02B
2028 250 × 161M = 40.25B 200 × 81M = 16.1B 56.35B
2029 450 × 224M = 100.8B 300 × 112M = 33.6B 134.4B
2030 750 × 294M = 220.5B 500 × 147M = 73.5B 294B

Existing clients 12 months + new clients avg. 6 months factored

4Revenue Stream Detail

Year Comm.
(7% net)
SaaS
(DVRP·POP)
AI Token
(Doc·WF)
Total
2026 3.6 0.4 0.2 4.2
2027 15.4 2.8 0.9 19.1
2028 39.5 7.2 3.1 49.8
2029 94.1 15.3 8.2 117.6
2030 205.8 30.5 18.3 254.6

Comm: gross 10% − PG fees 2-3% = net 7% | SaaS ARPU 1M→1.3M/mo | AI ARPU 100K→150K/mo

Per-client GMV = order size × monthly freq. | Existing 12-mo + new 6-mo weighted | Commission 7% = 10% gross − PG 2-3% | SaaS·AI additional streams

2026 ROADMAP

Phased Expansion Strategy

Q1
Q2
Q3
Q4
PLATFORM
REINDEERScore
2025 Launch → Q1~ Stabilize · Workflow · Onboarding · Operations
DVRP
Q1 Beta
Q2 Stabilize·Integrate
POP
Q2 Beta·Launch
Q3~ Stabilize
Document AI
Q1 Beta
Q2~ Ops · Accuracy · POP integration
Workflow AI
Q1 Beta
Q2~ Ops · Process automation · Enhancement
AI Enhancement
RAG optimization · Multimodal · Accuracy 90%+
SALES & OPERATIONS
Client Sales
Client acquisition · POP all-in-one onboarding
Supplier Sales
Supplier acquisition · Marketplace integration
Forwarder Sales
Forwarder sales · Bidding service · Logistics partners
GLOBAL EXPANSION
Malaysia
Platform launch · Stabilize · Local entity setup
China
Platform launch · Stabilize · Local entity ops
Korea
Platform · Entity prep
Vietnam
Platform · Entity prep

Year-end 2026: 120 paying clients · GMV ₩51B · AI accuracy 90%+ · 2+ country pilots

POP STRATEGY

Infrastructure Lock-in Strategy

SEA Digital Gap

Global ERP— High cost · Long deployment · Poor localization
Local ERP— No trade/logistics integration · No email
Current Ops— Gmail + Excel + Manual · Lost on resignation
95%+
No system

POP All-in-One Digital Infra

Operations
MES+ERP+WMS
Business Email
History preserved
Company Site
Auto-generated
AI Service
Doc·Workflow AI
All of this for
₩1M/mo
Regular ₩3M · 67% off
1 year only

LAND & EXPAND Strategy

LANDYear 1 — Entry
₩1M/mo all-in-one onboarding
1 year full operations data accumulation
→ System of Record acquired
EMBEDData Lock-in
Ops · Email · Site all on POP
Switching requires data migration + redesign
→ Switching cost >> retention cost
EXPANDYear 2+ Growth
SaaS full price ₩3M + AI billing
REINDEERS marketplace auto-integration
→ ARPU 3×↑ + GMV growth
Year 1 ARPU
₩1M/mo+ AI
Discounted
Year 2+ ARPU
₩3M/mo+ AI Token ↑
3×↑

1-year discounted onboarding → data lock-in then full-price conversion + AI billing → REINDEERS marketplace lock-in · ARPU 3× growth

GLOBAL EXPANSION

Global Expansion Strategy

Phase 1 Expansion Target Countries

1
TH Thailand
Home market · initial validation complete
Now
2
Indochina Peninsula Neighbors
Indochina peninsula logistics connection
2026 Q3
3
China
World's largest manufacturing · trade market
2026 Q3
4
VN Vietnam
High growth potential
2027
5
US Korea Northeast Asia
Large-scale B2B market
2027+

Country-specific Platform Elements

Localization

Language, currency, trade regulations, tax system adaptation

Local Partnerships

Collaboration with local forwarding, logistics, financial institutions

Regulatory Compliance

Country-specific data sovereignty, privacy law compliance

Payment Systems

Credit card, bank transfer, mobile pay integration

Shared technology foundation → Core platform code · AI models · data schema shared to minimize development cost when adding countries

Country-independent platform structure for customized response to each market's regulations · language · business practices while maximizing core technology development efficiency

RISK MANAGEMENT

Potential Risks and Mitigation Strategies

Initial Customer Acquisition

Multi-sided platform cold start

Response

Industry-specific pilots (electronics·textiles). Migrate existing relationships to platform.

Regulatory Complexity

Country-specific compliance costs

Response

Local legal advisors + partner collaboration. Prioritize simpler-regulation countries.

Large Competitor Entry

SAP, Oracle, Flexport similar features

Response

Rapid 2026 market entry for first-mover advantage. Build network effects early.

Development Delay

3 platforms simultaneous dev load

Response

MVP-first per platform, progressive feature add. Agile dev on customer feedback.

Pre-emptive mitigation strategies established for each risk — Phased execution to minimize risk

NETWORK

Global Network Status

11 years of accumulated SEA · East Asia manufacturing · trade partner network

Global Network Distribution

Total Network 4,300+ — Customers 2,500+ · Vendors 1,800+ — Thailand · Korea · China · Vietnam · Malaysia

ON THE GROUND

Manufacturing Partner Sites

Direct visits to SEA manufacturing partner factories and supply chain verification

Raw material warehouses, CNC machining, injection molding, press operations — On-site supply chain verification completed

ON THE GROUND

Client Meetings & Partnerships

On-site client visits, product demos, and partnership building

On-site client visits, product demos, manufacturing partner tours — Building on-ground business relationships

WHY INVEST NOW

Why Now Is the Right Time to Invest

Market, team, technology, traction — 4 core validation results.

$130B
SEA B2B Market
4,300+
Partner Network
2 Patents
AI Tech IP
960M
2025 Revenue (KRW)
01Market Timing

$130B SEA B2B market digital transformation accelerating

CAGR 15% Surging demand for AI-based supply chain solutions

Regulatory tightening Creating an environment where automation is essential

02Proven Team Capability

11 years field experience + 25,000 transaction records

AI/ML team Specialized technology team assembled

Thailand subsidiary Local operations + 4,300+ network

03Technology Edge

2 Patents Import/export management + AI supplier recommendation

RAG AI Agent development completed

Proprietary data Real transaction-based training data

04Proven Traction

2025 Revenue 960M KRW 59 deals · YoY +77% (direct export)

350+ partners Existing network convertible to platform

CAGR ~90% 2024→2030 revenue-based

Market timing + proven team + technology edge + traction — All 4 core factors validated, making now the optimal investment point

VALUATION

Company Valuation

NTM (Next Twelve Months) — Based on projected 2027 break-even revenue, B2B SaaS median multiple applied

2027 Projected Revenue (NTM)
1.91B KRW
Break-even Year
Applied Multiple (B2B SaaS Median)
PSR 5.2~6.3x
No Premium Applied
Enterprise Value (Pre-money)
10~12B KRW
1.91B × 5.2~6.3x

Factors Supporting PSR 5.2~6.3x

#FactorValue
1B2B SaaS median PSR range5~8x
2Revenue growth (5x vs SaaS median)YoY +77%
3GMV CAGR (2026→2030)~176%
4Proprietary data (11yr transactions)25,000+
5Platform switching cost (data lock-in)High
6TAM — digital penetration <5%$108B+
7Multi-country infrastructure4 countries
AI Premium Not Applied

Through SaaS platform transactions, B2B data accumulates naturally, forming the foundation for AI learning.

With AI premium (PSR 10~15x)
19.1~28.6B KRW
Not included in current 10~12B proposal

Data Flywheel
More transactions → Data accumulation
AI accuracy improvement
→ Customer value increase
More transactions (self-reinforcing)

B2B SaaS median multiple applied · AI premium not included — Conservative NTM-based enterprise value 10~12B KRW

CROSS-VERIFICATION

Cross-Verification & Investment Proposal

Enterprise value verified through 2 independent valuation methods

Cross-Verification

1VC Method
2027 Revenue ~$1.47M × mature multiple 10x = $14.7M
Discount rate 40%, 2yr: $14.7M ÷ (1.4)²
= ~$7.5M ≈ 9.75B KRW
2Comparable Analysis
Bizongo (B2B supply chain) PSR 18.3x
+ AI premium 30% = PSR 23.8x
2026 Revenue 420M KRW × 23.8x
= ~10B KRW
✓ All methods converge at 9.5~12B KRW range

Investment Proposal

Pre-money10~12B KRW
Investment500M KRW
Post-money10.5~12.5B KRW
Investor Equity4.0~4.8%

Group Capital (Mar 2026 FX rates)

EntityCapitalKRW
Korea (HQ)326M KRW326M
Thailand2,000,000 THB~93M
China1,000,000 CNY~214M
MalaysiaMin. capitalBiz prep
Total~630M

VC Method · Comparable Analysis — Independent verification confirms 9.5~12B KRW convergence

INVESTMENT

Investment Utilization Plan

Target Investment Amount
500M KRW
Investment Purpose
Platform completion · customer acquisition · global expansion preparation
40% 30% 20% 10%
Tech Development (DVRP·POP·AI)
Market Entry (Marketing·Sales)
Team Expansion (Hiring)
Operations & Legal

Key Milestones (12 Months Post-Investment)

1
Client Acquisition: 120+ paying clients (Buyer+Vendor+Forwarder combined)
2
Transaction Volume: Platform GMV 5.1B KRW
3
Platform Complete: DVRP · POP official launch and stabilization
4
AI Accuracy: Quotation recommendation hit rate 90%+, document error detection 95%+ (monthly measurement)
5
Global Ready: Pilot projects started in at least 2 countries

40% of investment focused on technology development — Target: 5 key milestones within 12 months

CALL TO ACTION

Together, let's build
the future of global
B2B trade

REINDEERS is not just software.
It is a paradigm shift where international
trade, logistics, and POP are unified,
and AI assists decision-making —
next-generation B2B infrastructure.

Investment Inquiries

REINDEERS Inc.

We are looking for investors who will
join us in building the future of
global B2B trade.

Through investment, let's together
achieve first-mover position in the
SEA and global B2B trade platform market.

“The $130B Southeast Asian trade market is ready for AI.
11 years of real operational data, 6 proprietary platforms, infrastructure across 4 countries
— no other team has this technology and execution power.
This is the moment to join us.”

Platform URLs11 Services
REINDEERSwww.reindeers.com
VENDORSvendor.reindeers.com
FORWARDERforwarder.reindeers.com
DVRPdvrp.reindeers.com
POPpop.reindeers.com
Document AIdai.reindeers.com
Workflow AIworkflow.reindeers.com
Businessbusiness.reindeers.com
Corpcorp.reindeers.com
Blogblog.reindeers.com
IRir.reindeers.com
REINDEERS 2026 | Architecting the Future of Trade with AI — From Southeast Asia to the World